Historical material. Dates, proposals and invitations refer to the time of the original publication.
Perceived country interest
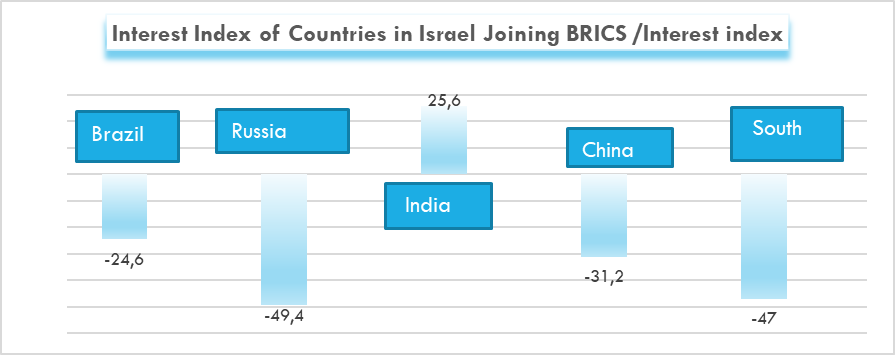
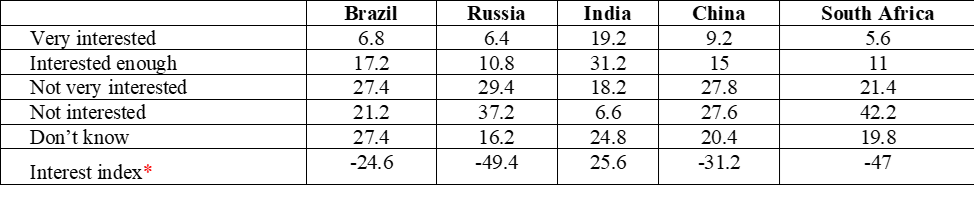
In respondents’ assessments, only India has a positive published interest index for Israel joining BRICS:+25.6 percentage points. Brazil, Russia, China and South Africa have negative indices. These are survey perceptions, not verified government intentions [editorial clarification].
See the country as interested
Brazil
24%
Russia
17.2%
India
50.4%
China
24.2%
South Africa
16.6%
The two positive responses added from the printed table. These are respondents’ perceptions, not verified government positions.
*Calculated as the difference in varying degrees of positive and negative responses (for example, Brazil: (6.8% + 17.2%) — (27.4% + 21.2%) = -24.6)
Regional differences
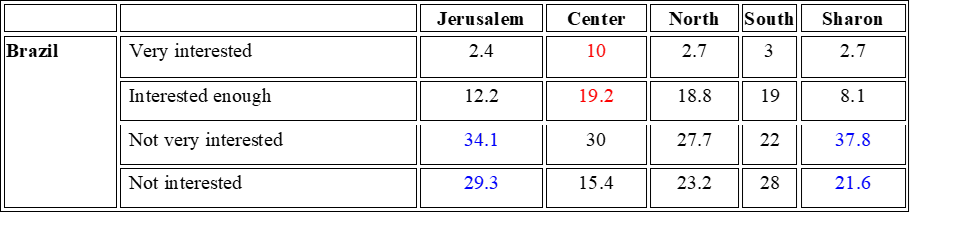
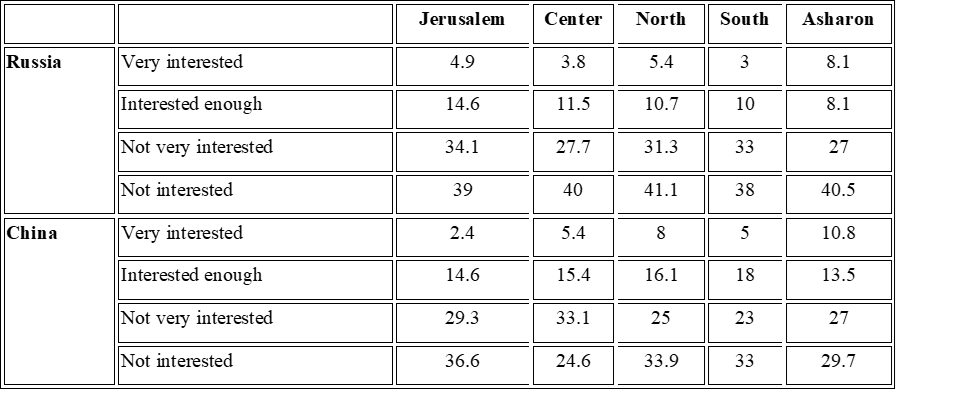
Let us note that in terms of education and religiosity, no fundamental differences or stable trends were found. It is interesting that residents of the center of Israel speak more often about such interest in Brazil (very, very interested — in total, about 30% of respondents in this area report, and a similar maximum value in other areas is 23%), while disinterest in such cooperation is fundamentally more often said residents of Jerusalem and Asharon (almost completely not interested — about 60% in total, and among other areas — 50% and below).
Table 3.2. Country’s interest in Israel joining BRICS %
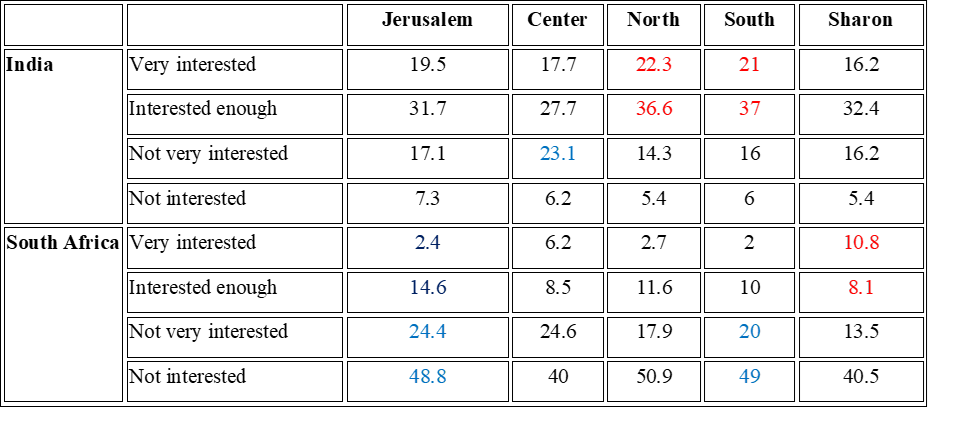
Residents of the North and South most often talk about India’s interest, and the Center’s lack of interest. Relatively (but not fundamentally) higher assessments of South Africa’s interest are given by residents of Asharon, and the lowest by Jerusalem and the South, although by and large the assessments here are quite even.
Table 3.3. Country’s interest in Israel joining BRICS %
The slightest differences in the responses of residents of different regions of Israel concern the interest of Russia and China in Israel joining BRICS.
Table 3.4. The country’s interest in Israel joining the BRICS union%
An analysis of the “extreme” values of answers (the largest and the smallest) by regions of Israel showed that the residents of Jerusalem and Asharon, who equally give such assessments the greatest number of times, differ more than others in this parameter. However, residents of Jerusalem are most often characterized by negative expectations from countries regarding Israel’s accession to BRICS.
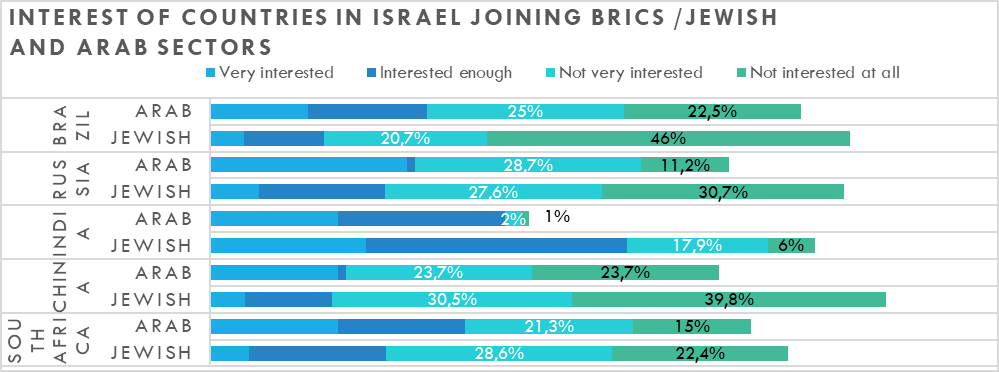
Jewish and Arab sectors
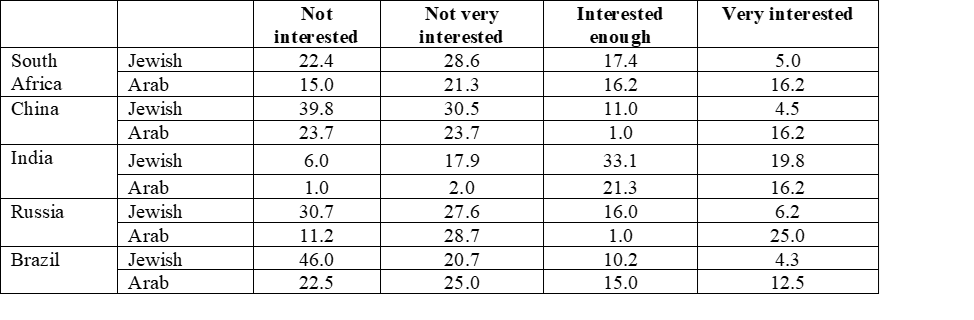
The published English table gives positive responses for India of 52.9% in the Jewish sector and 37.5% in the Arab sector. The latter is lower, but this does not mean negative answers predominate. Other country labels and graphical series differ between the sources. The English numeric table is therefore reproduced explicitly below with the disagreement identified, rather than asserted as an unqualified cross-language comparison [editorial clarification].
English table: country labels differ from the Russian chart
South Africa · English table: country labels differ from the Russian chart
Response
Jewish sector
Arab sector
Not interested
22.4%
15%
Not very interested
28.6%
21.3%
Somewhat interested
17.4%
16.2%
Very interested
5%
16.2%
China · English table: country labels differ from the Russian chart
Response
Jewish sector
Arab sector
Not interested
39.8%
23.7%
Not very interested
30.5%
23.7%
Somewhat interested
11%
1%
Very interested
4.5%
16.2%
India · English table: country labels differ from the Russian chart
Response
Jewish sector
Arab sector
Not interested
6%
1%
Not very interested
17.9%
2%
Somewhat interested
33.1%
21.3%
Very interested
19.8%
16.2%
Russia · English table: country labels differ from the Russian chart
Response
Jewish sector
Arab sector
Not interested
30.7%
11.2%
Not very interested
27.6%
28.7%
Somewhat interested
16%
1%
Very interested
6.2%
25%
Brazil · English table: country labels differ from the Russian chart
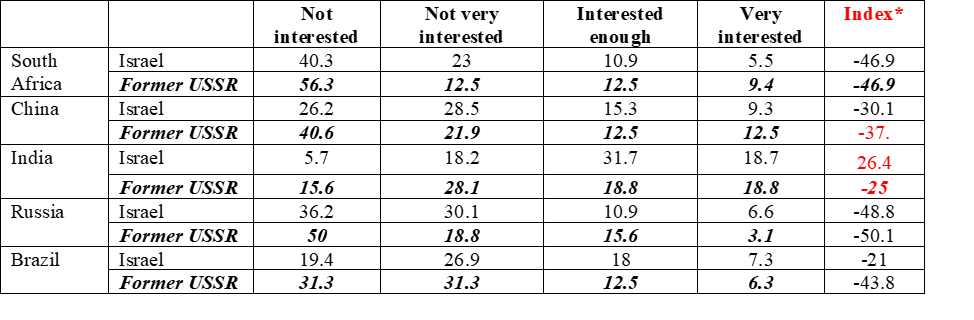
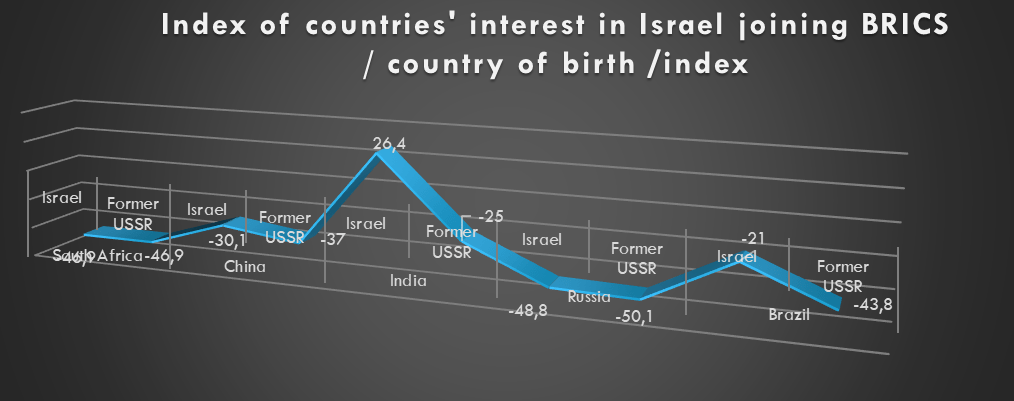
A comparison of the position of native Israelis and immigrants from the territory of the former USSR is more clear in the Country Interest Indexes, located in the table and diagram.
Table 3.5. Interest of countries in Israel joining BRICS % / country of birth
The index is positive responses minus negative responses. India’s published index among Israel-born respondents is +26.4 points; the printed rounded cells give(18.7+31.7)−(18.2+5.7)=26.5. The published value and recalculation are shown separately.
The index values show that the expectations of the Sabras and immigrants from the territory of the former USSR converge with regard to the interest of South Africa and Russia, and are close with regard to China.
The source describes the India index gap between Israel-born and former-USSR-born respondents as exceeding 50 points, using +26.4 and −25. The printed cells instead produce 26.5−(−6.1)=32.6 points, so the gap needs checking against the underlying data. Brazil’s published indices −21 and −43.8 differ by 22.8 points [editorial clarification].


 Global connections
 Research & archive